
Xutra / Blog post
How to Backtest a Trading Strategy Before Going Live
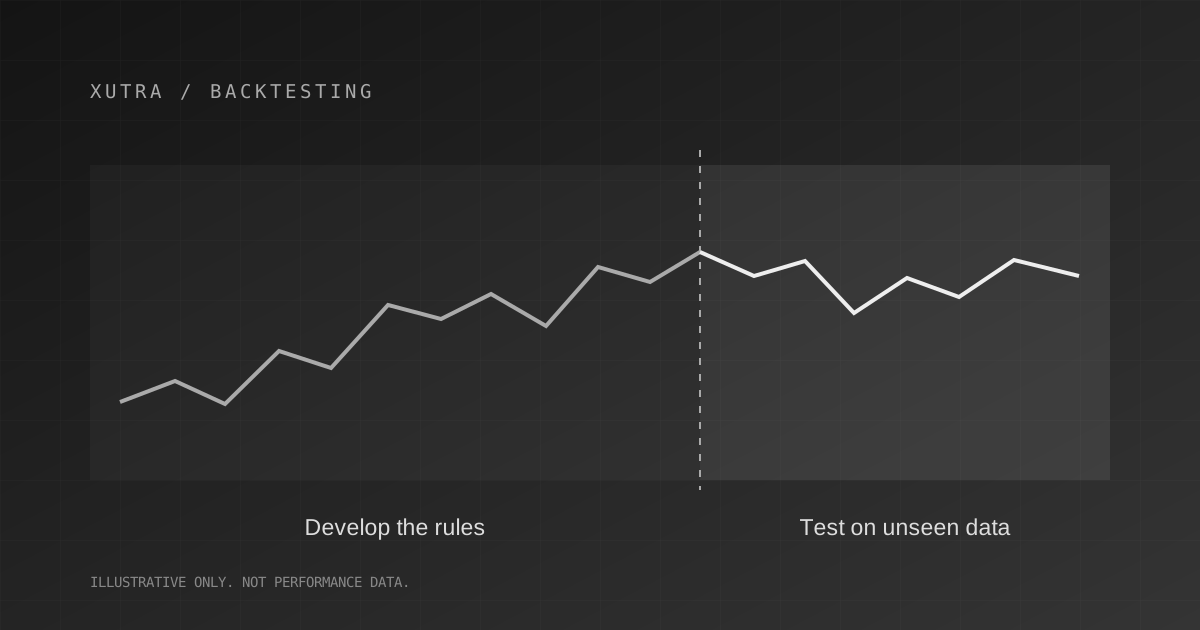
Backtesting means applying a set of trading rules to historical data to see how those rules would have behaved under stated assumptions. It is useful because it forces an idea to become specific. It is dangerous when a neat profit curve is mistaken for evidence that the same result will occur with real money.
Before asking how much a strategy made, ask what the test actually simulated. A result built from candle closes, ideal fills, and zero transaction costs describes a different trading environment from a live account. The quality of the assumptions matters at least as much as the final return figure.
Start with a rule someone else could reproduce
Write down the instrument universe, signal timeframe, entry conditions, exit conditions, position sizing, and trading hours. Include the rules for re-entry and simultaneous signals. A phrase such as buy when momentum looks strong is not testable. A measurable condition based on information available at a specific time is.
Timing needs special care. If a signal depends on a candle's closing price, the strategy cannot know that closing price before the candle ends. Assuming an execution at that exact close may be optimistic, depending on the implementation. Decide when the order could actually be sent and what price information was available then.
Use data that can answer your question
Check the data interval, timestamps, missing records, and treatment of corporate actions. If the strategy trades derivatives, verify how the dataset identifies contracts and expiries. A continuous futures series can be useful for research, but it is not the same thing as a directly tradable contract with a real rollover process.
Kite Connect's historical data documentation, for example, describes candle records containing timestamp, open, high, low, close, and volume, with optional open interest. It also describes specific limits around continuous futures data. Read the documentation for your own provider rather than assuming that every historical dataset has the same coverage.
Source: Kite Connect historical candle data documentation
A candle does not show the full sequence of prices inside it. Suppose a candle's high reaches your profit target and its low reaches your stop. Without finer data, you may not know which happened first. Your test needs a documented rule for that ambiguity. Always choosing the profitable outcome can turn an ordinary strategy into an impressive-looking fiction.
Include costs before comparing strategies
Build in brokerage and applicable transaction charges using assumptions appropriate to the instrument and broker. Model the bid-ask spread and slippage as well. Slippage is the difference between an assumed execution price and the price obtained in practice. It can become larger when liquidity is thin, prices move quickly, or order size increases.
Consider a purely hypothetical test with an average gross profit of ₹40 per completed trade and estimated round-trip costs of ₹30. Only ₹10 remains before any additional execution shortfall. A small change in assumptions could erase that margin. This example is not a claim about typical costs or returns; it illustrates why gross profit alone is not enough.
Look beyond win rate
- Maximum drawdown: the largest measured decline from a previous equity peak during the test.
- Average win and average loss: whether a few large losses overwhelm frequent small gains.
- Trade count: whether the conclusion depends on too few observations.
- Exposure and turnover: how much capital is committed and how often it is traded.
- Performance by period: whether most of the result comes from one unusually favourable stretch.
A high win rate can coexist with a losing strategy. In another hypothetical example, 80 winning trades at ₹100 each produce ₹8,000, while 20 losing trades at ₹500 each lose ₹10,000. The strategy is down ₹2,000 even before costs. Look at the distribution of outcomes, not just how often the trades were right.
Reduce the temptation to overfit
Repeatedly changing parameters until historical results look good can fit the rules to noise. Reserve a later period for testing without retuning, and record every variation you try. Check whether nearby parameter values produce broadly similar behaviour. A single exceptional setting surrounded by weak alternatives deserves scrutiny.
A separate test period is not magic either. Once you repeatedly inspect it and redesign around its results, it starts becoming part of the development process. Keep a research log that distinguishes the original idea, later changes, and the evidence that motivated each change.
Move from research to observation
After a backtest, observe the strategy on new data without assuming fills are guaranteed. Paper trading can help identify timing and workflow mistakes, although simulated execution remains different from real execution. Before any live deployment, define what would make you pause the strategy and how you would verify outstanding orders.
Xutra's automation workflow is intended to connect strategy building, testing, and execution controls. Use that connection to make assumptions visible, not to skip review. A credible backtest should help you decide what to investigate next. It should never be presented as a promise about the next trading session.
Education only · Not investment advice